Climate change impacts on agriculture
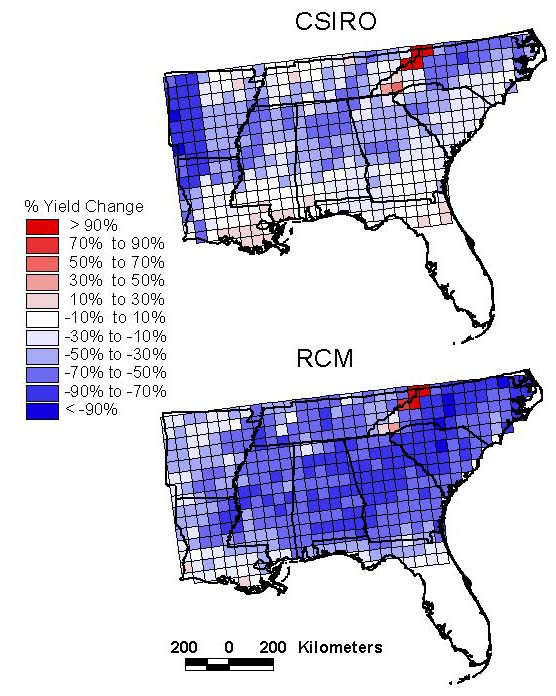
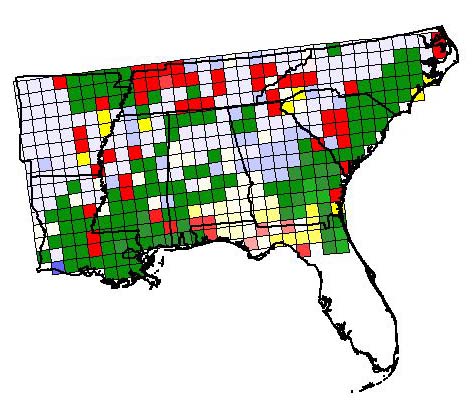
Some projections of 21st-century temperature and precipitation change in the Southeast would cause dramatic losses to agriculture. The first maps below show how soybean yield responds to two climate change scenarios. When estimating the impact of future climate change on crop yield, it is important to consider how plants may benefit from increased atmospheric carbon dioxide and how farmers may adapt to changing conditions. To this end, the final map shows two specific adaptation strategies: planting fast-growing varieties early (blue grids) or slow-maturing varieties late (green and red grids). Both strategies significantly reduce crop losses.
Drought forecasting
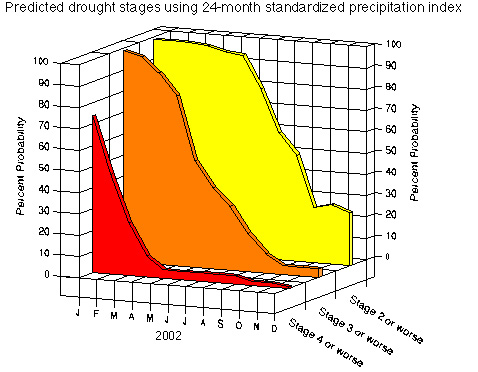
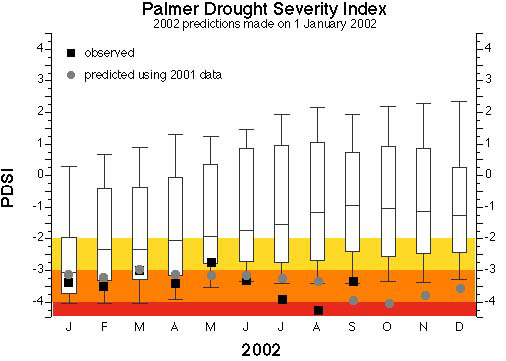
Because temperature and precipitation patterns may vary greatly across South Carolina, it is necessary to tailor drought forecasts for individual stations. Drought indices are used to declare specific drought stages and to establish water-use restrictions. Below line graphs show the predicted probability of moderate (yellow), severe (orange), and extreme (red) drought stages for 2002. The box plots below show the likelihood that water resource managers would face water restrictions in the coming year. They depict the 10th, 25th, 50th, 75th, and 90th percentiles of exceeding specific PDSI values from resampled data. Predictions were made for 2002 on January 1 when the PDSI was -3.05. As a reference, predicted PDSI values using "another year like last year" are also provided.
|